What can we learn from looking at Africa through the lens of its cities?
This blog is the sixth in a series exploring different aspects of city development and urban change in Africa, featuring contributions from researchers and practitioners working within the African Cities Research Consortium.
Curated by David Satterthwaite, it is similar in content and structure to a blog series he oversees at IIED but with a focus on Africa. The first few articles will explore large cities in Africa – in particular the 100 largest cities that were home to 244 million people in 2020, just over two-fifths of the continent’s urban population.
The first blog looked at how the size and the spatial distribution of large cities changed between 1800 and 2020, the second blog explored Africa’s largest cities viewed over the last 16 centuries, the third blog delved into what we don’t know about these cities, the fourth blog considered what we do know – with a focus on the drivers of contemporary urban change – and the fifth blog explored the invisibilising impact that a lack of data can have on city residents.
By David Satterthwaite, senior fellow in IIED’s Human Settlements research group
Following on from our previous discussion on the deficiencies in official data needed for planning and governing cities, this blog looks at how city governments and community organisations are turning to other data sources.
When city governments do not get local census data and are not served by household surveys, there are other sources of relevant data. These include service providers’ records – for instance, people served by the water utility or using a government health centre. But are these records available to local government, and how good is their coverage? They have no data on unserved households, which often represent a high proportion of a city’s population.
Where censuses are done well, and their data is made available to local governments and civil society, they are the most inclusive data source, as they cover every household. However, an article in The Economist noted that some high-income nations have replaced censuses with the data that government already has – for instance, on individuals’ health, employment and residence. This won’t work for those where no such records exist, or those who live in an informal settlement without a registered address. This often this means that 30-50% of the population in cities in the Global South – and, for some cities, more than this – are invisible.
Many city governments have responded to deficiencies in official data by collecting their own. This includes efforts to draw together all the relevant data held by different departments within city government to provide a common database from which all can draw; or working with the universities in their cities.
Participatory processes: voice and data
Participatory processes can also tap into the knowledge and commitment of the people engaged, to create new information sources. For instance, participatory budgeting (PB) brings the knowledge of those who engage in the neighbourhood, sector or city-wide discussions that set priorities for local government for what is done and funded. An assessment of the impact of PB on basic services in 20 cities included four African cities and sub-municipal electoral districts: Ampasy Nahampoana in Madagascar; Dondo in Mozambique; Yaoundé Commune 6 in Cameroon; and Rufisque Est in Dakar, Senegal.
It may seem odd to include participatory budgeting in discussions of data availability. Data on service provision is meant to inform local government – and to provide the data needed to address deficiencies. But data on deficiencies in basic service provision can also come from a city government’s engagement with citizens and their community organisations, as in participatory budgeting.
To give an example, the participatory budgeting council of Commune 6 in Yaoundé was chaired by the mayor, and included civil servants, civil society actors and private sector representatives.
JD Nguebou, who took part in the discussions, notes: “Participatory budgeting modifies relations… budgetary decisions depend upon citizens’ decisions. It has an influence on budget. Another major change is that people’s voice became meaningful, and elected politicians listen more to citizens.”
PB therefore ensures that democracy is not only about votes, but also about voice and the data that voice can contribute.
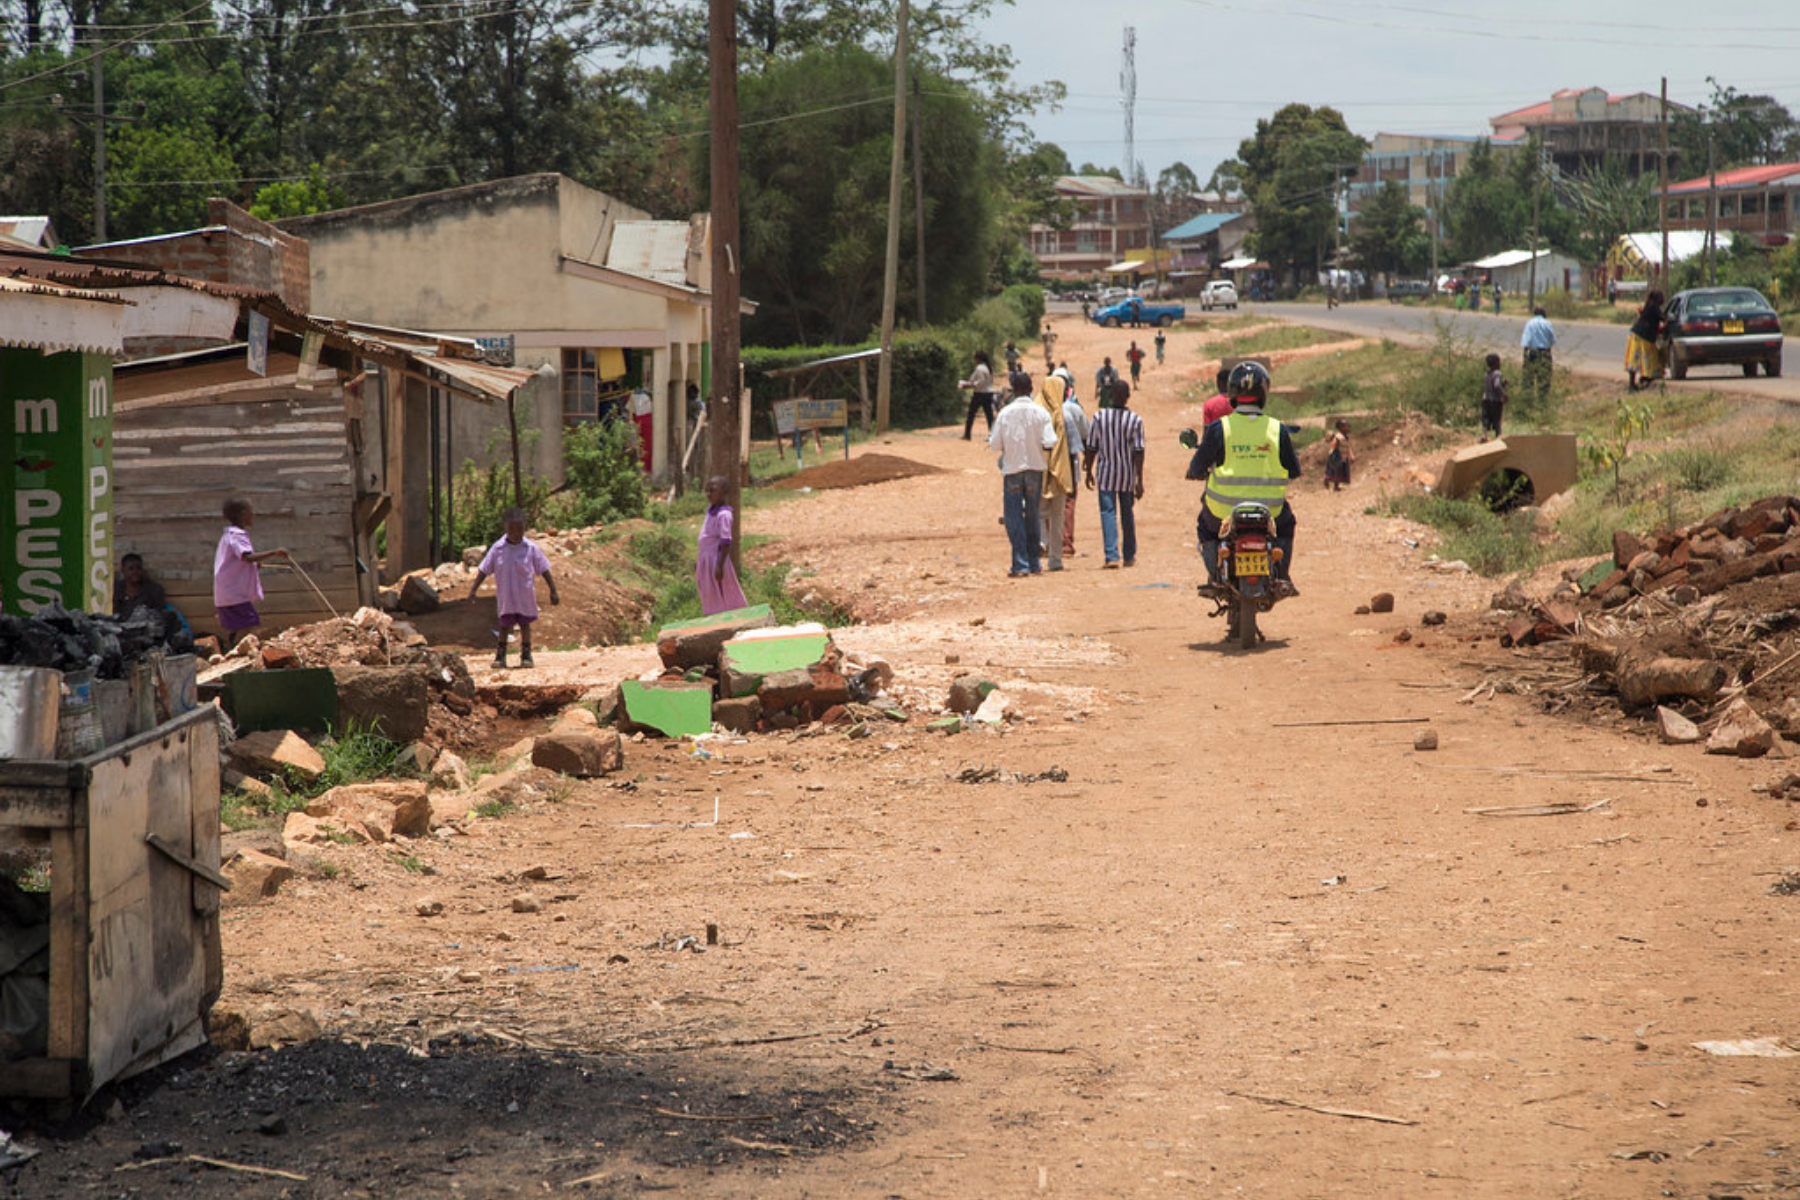
Small shops line a street outside of Kisumu, Kenya. Photo credit: Peter Kapuscinski / World Bank (CC BY-NC-ND 2.0)
Remote sensing
Over the last two decades, new methods have been developed to map informal settlements from satellites. High-resolution satellite maps have proved very useful in improving the quality and detail of city maps and can provide data on building characteristics, site layouts and urban expansion. But, by themselves, these tell us very little about who lives and works in the settlements mapped or about the quality of public services – and nothing about the residents’ needs and priorities. They can, however, provide the base map for informal settlements and for guiding data gathering by residents. This can be combined with data from censuses, service providers and health systems, if these are available.
Research findings can also address the lack of data. There is a large and rapidly growing literature on cities that brings depth and detail to all the issues raised above. It is from detailed case studies that we learn about the less visible factors. While this type of research can enrich our understanding, it cannot provide needed city-wide data. But there are three important exceptions.
The first is the research of the African Population and Health Research Centre (APHRC) in informal settlements in Nairobi. This includes two demographic and heath surveys that had the depth and detail of the conventional Demographic and Health Surveys (DHS) but that focused on Nairobi’s informal settlements. They provided a mass of valuable data on health and determinants of health (including basic services) for each informal settlement – see Table 1. This is disaggregated data that a conventional DHS cannot provide. And it shows that informal settlement dwellers have under-five mortality rates of 8-30 times the rate in high-income nations. Hopefully such data will spur change to address this.
Table 1: Under-five mortality rates in informal settlements in Nairobi
The second is building a detailed city-wide database on risks from a combination of newspaper reports, hospital records, and databases or records of government departments. This draws on the DesInventar methodology that was developed in Latin America – but is now applied in many other regions – as illustrated by a report on Ibadan. Excluding public health risks for which data is scarce and incomplete, road traffic accidents, crime, violence and flooding constitute the most serious hazards in the city of Ibadan.
The third exception is community-driven mapping and data collection. This data source is provided by grassroots organisations and federations which map and survey their informal settlements. perhaps the most surprising and most transformative new source of city data, as many cities have a third or more of their population scattered across dozens or hundreds of informal settlements, for which there is little or no data. Perhaps as remarkable as this community-led process is the global network of slum/shack dweller federations that are using this process and sharing their experiences in developing it. They have also formed a secretariat to support them: Slum/Shack Dwellers International (SDI), who are core partners of the African Cities Research Consortium.
There are now over 30 national federations who are SDI affiliates using these methods – to produce the data they need for their discussions and plans and to get the attention of city government. They include ten African federations (Ghana, Kenya, Malawi, Namibia, Sierra Leone, South Africa, Tanzania, Uganda, Zambia and Zimbabwe) that have achieved national or citywide scale and have worked with governments to secure and develop land for the urban poor.
These are federations of informal savings groups, in which most savers and savings group managers are women. They developed the methodologies to document and map informal settlements and have applied these to thousands of informal settlements in over 500 cities. Much of this is part of SDI’s Know your City campaign. The federations have demonstrated their capacity to do this in settlements that have long been ‘invisible’. They overcome residents’ hostility to data gatherers because it is being done by them and documents their priorities.
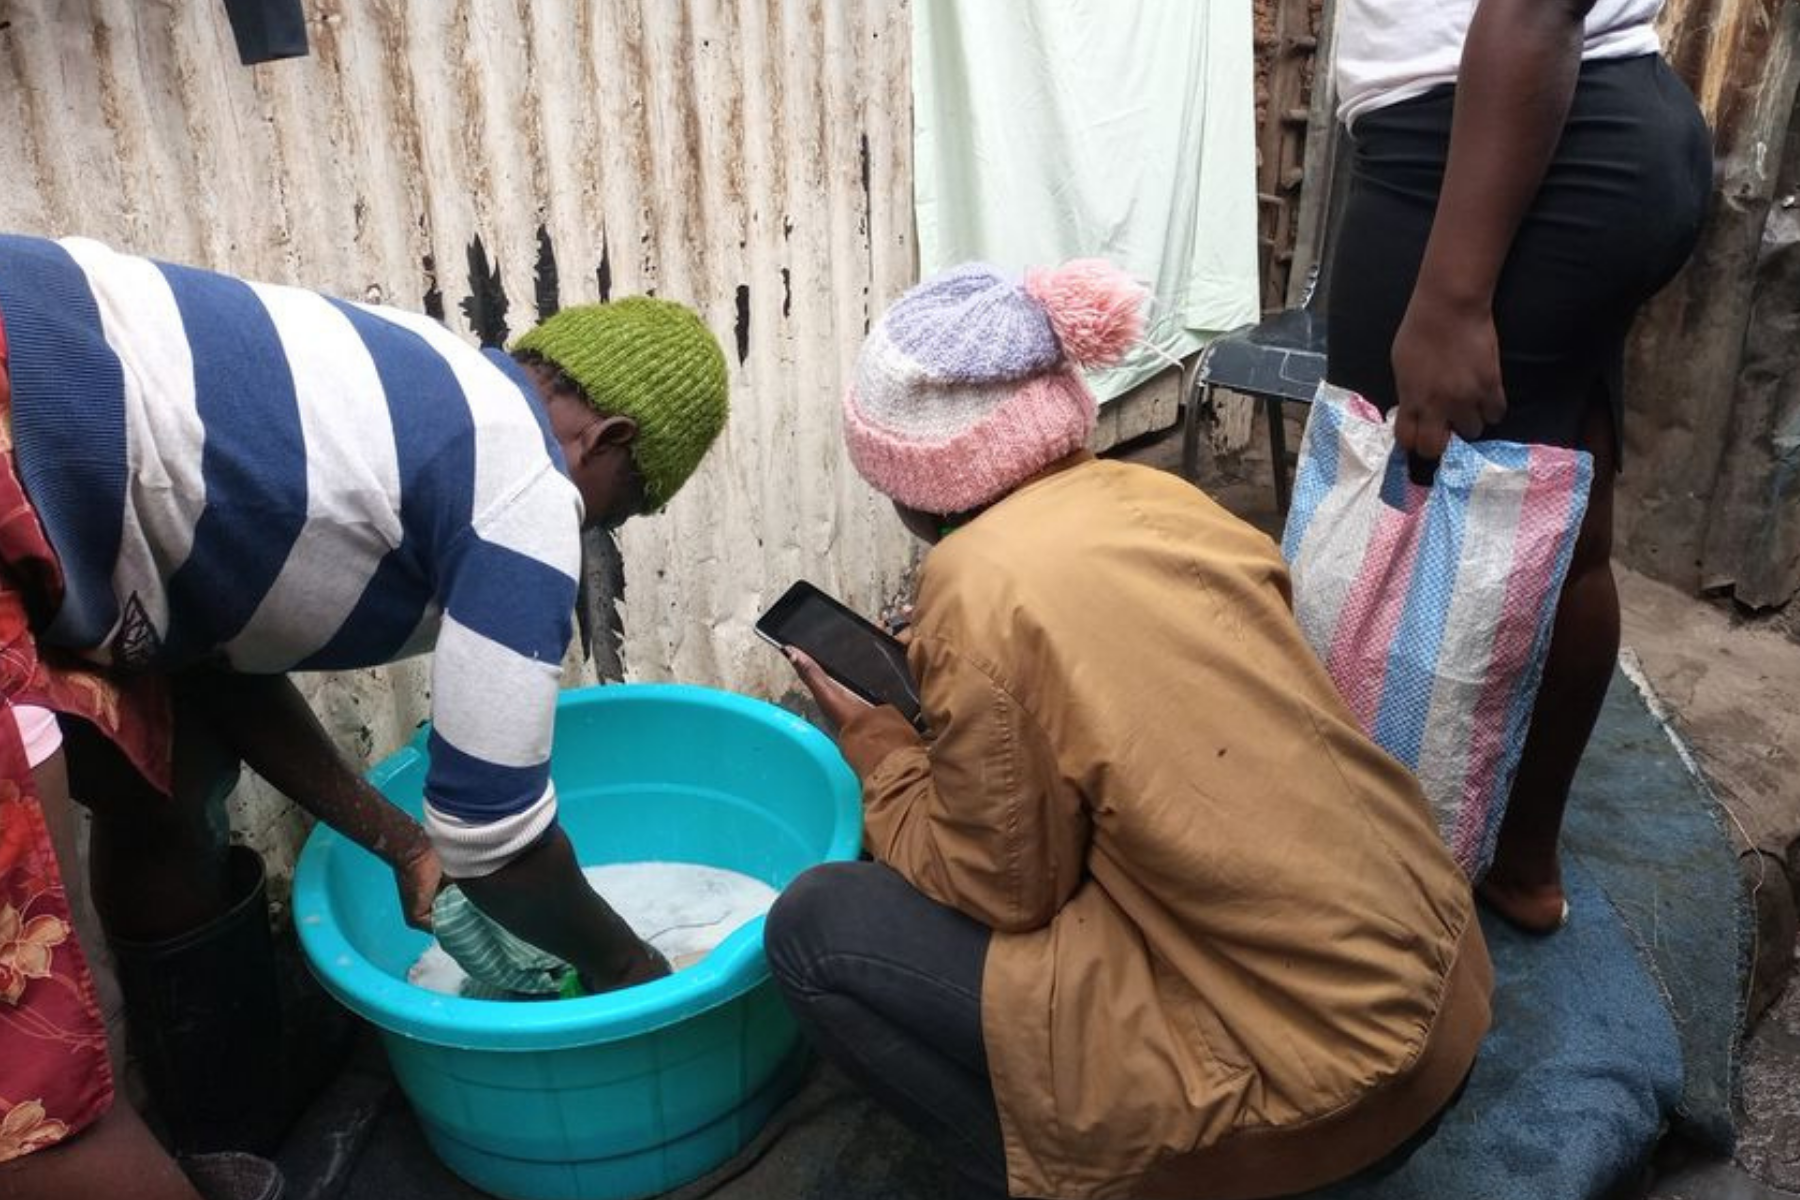
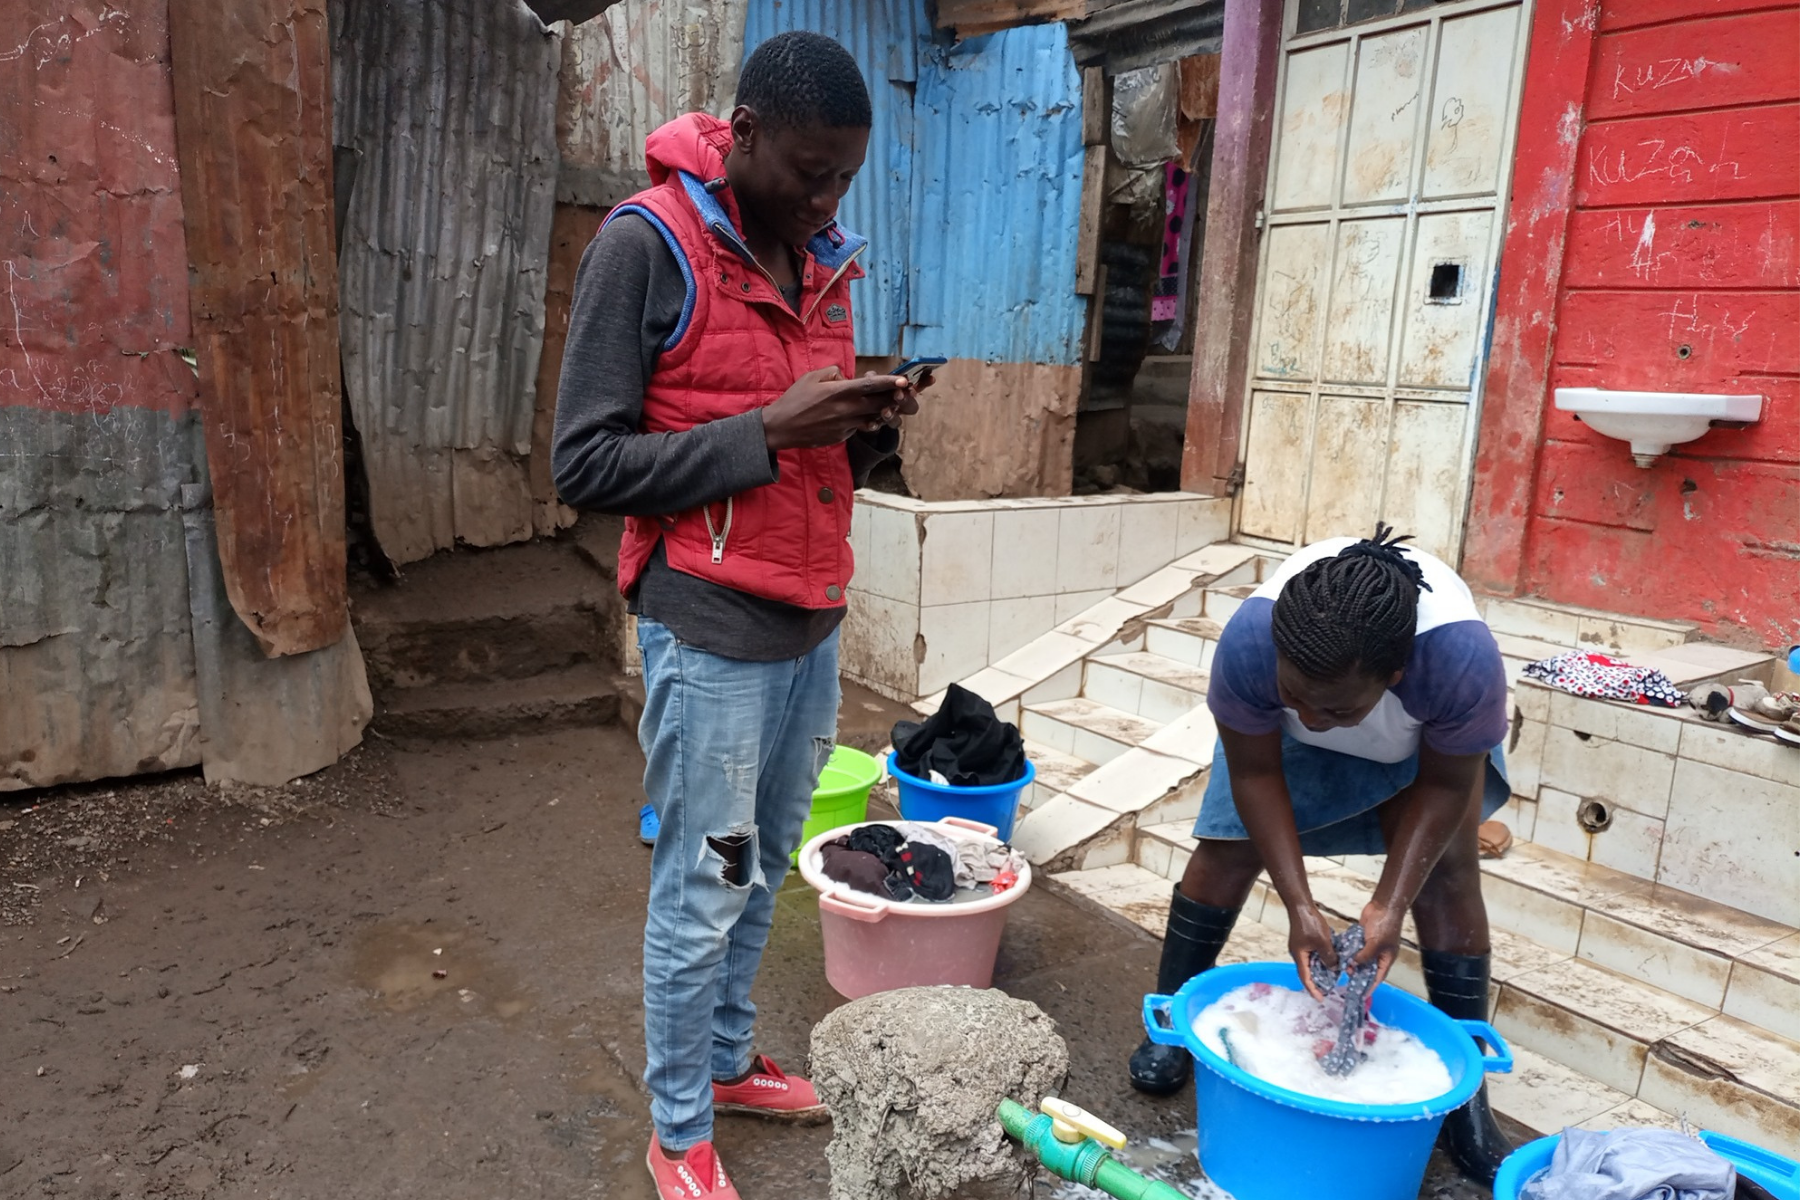
Enumeration exercise in Mathare, Nairobi – part of a global campaign to collect data on informal settlements. Communities can leverage consolidated data gained through these enumerations to advocate for resource provision at the community level. Photo credit: Muungano wa Wanavijiji / Know Your City TV
These maps and data are also invaluable for city governments. When a city government agrees to support the upgrading of informal settlements, the federations carry out the equivalent of censuses, with each household interviewed and each dwelling numbered and located on a map and recorded, using GIS.
To give one among dozens of possible examples, the Shack Dwellers Federation of Namibia developed the capacity to undertake enumerations and mapping of informal settlements. With support from the national government and a local NGO, it developed the Community Land Information Programme to profile and map all the informal settlements in Namibia, covering more than 500,000 people without secure land tenure.
In Mukuru, one of Nairobi’s largest informal settlements, the Kenyan Federation, Muungano wa Wanavijiji, has been commissioned by local government to develop an upgrading programme. Community-led data collection has served not only the planning but also the many discussions and the difficult task of generating agreement among around 100,000 households on a range of interests. More recently, SDI mapping has been used by the Kenyan national government as part of its Covid-19 response.
Box 1: Community data collection in Kisumu, Kenya
To give an example of the depth and detail of enumerations, in Kisumu, grassroots profiles of each of the city’s 28 informal settlements reported on the quality and extent of provision for water and sanitation, along with other infrastructure and services. The collection of this data then provided the basis for discussions about residents’ priorities for interventions in their settlements.
The Slum Dwellers Federation of Kenya – Muungano wa Wanavijiji – profiled nearly 221,000 residents in Kisumu’s informal settlements, where three-quarters of residents lived on dangerous sites, including flood-prone areas or near to garbage dumps. Most residents were tenants and 83% lived in temporary structures, with minimal services, major infrastructure deficits and poor access to health facilities only compounding the risks facing these residents. An estimated 69% of residents lacked regular water supplies and in 20 settlements, there were over 100 residents per working toilet. Regular garbage collection was almost non-existent. Since only 11 settlements had a health clinic inside, many residents were forced to walk long distances to clinics – posing major challenges for those with impaired mobility.
The questions asked in Kisumu (and other SDI enumerations) are very detailed. For instance, for water, questions were asked about the household’s main water sources (nine possibilities); number of individual, community and shared taps; functionality and water quality; who supplies the taps; and, on average, what households spend on water per month. Additionally, the enumerations indicate how long it takes a household to collect water; how many hours per day water is available; whether a settlement is connected to mains water; and general comments about water. For sanitation, questions included whether the settlement is connected to a sewer; whether people pay for using toilets (and if so, the average paid per month); mix of toilet types; public toilets and management; and average waiting time for a toilet.
Among other topics covered in SDI enumerations are the following:
- Land ownership and history for each informal settlement
- Demographic and structure details
- Location
- Evictions
- Garbage collection
- Healthcare
- Health
- Electricity
- Livelihoods
- Transport
- Education
- Commercial establishments
- Other services and establishments, such as playgrounds, banks, informal markets, fire and police stations, mosques, temples, churches
- Organisations, including community leaders and their roles
- Community priorities
A key part of the development of community-led surveys and enumerations in Africa is the experiences of their sister federations in Asia and the many learning exchanges between them. Also important were contacts with the Asian Coalition for Community Action that supported community-led enumerations or surveys and many innovative projects that also improved the working relationships with local governments.
For cities with informal settlements, by far the best, most detailed and most comprehensive data has come from their residents’ community organisations and federations. This data is collected to inform and catalyse action and to develop good working relationships with city governments. So the ‘slum’ censuses they design and implement are their census, their data. And, crucially, this data serves their plans and priorities.
Further reading:
- Over 50 papers on community led enumerations
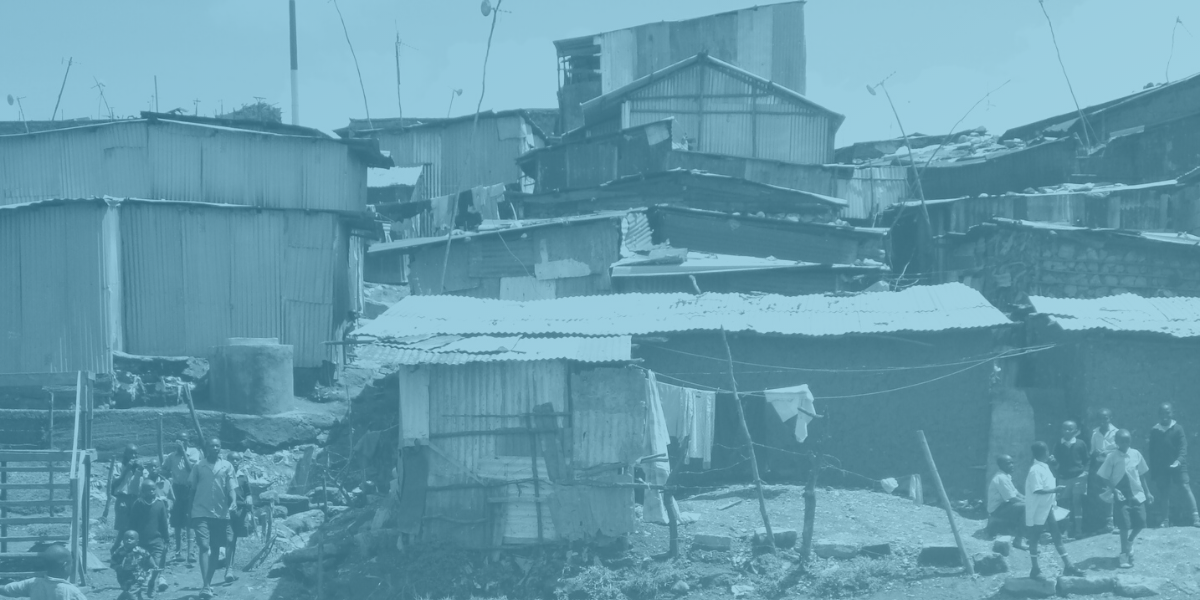
Header photo credit: SuSanA Secretariat / Flickr (CC BY 2.0). Iron sheet and mud houses in Mathare, Nairobi.
Note: This article presents the views of the author featured and does not necessarily represent the views of the African Cities Research Consortium as a whole.
The African Cities blog is licensed under Creative Commons Attribution-NonCommercial-NoDerivatives 4.0 International (CC BY-NC-ND 4.0), which means you are welcome to repost this content as long as you provide full credit and a link to this original post.
